Tabulatrix
Turn CSV, JSON, YAML and Excel into reports and diagrams ready to share.
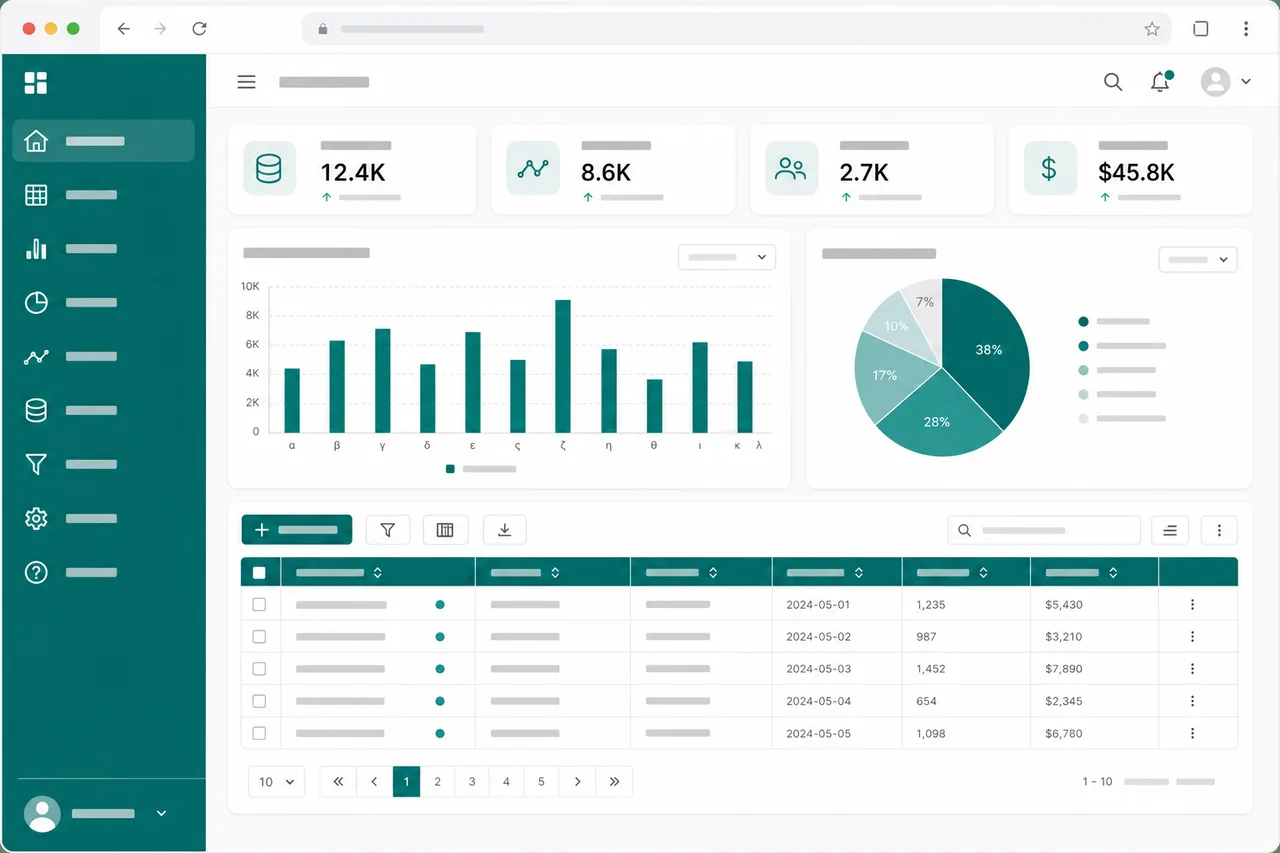
The data exists, but building a readable report still takes hours
You have the information in a CSV, a JSON export or an Excel sheet, but turning it into a presentable report or diagram means copying, pasting and formatting by hand, over and over.
- Every report is built from scratch in a new spreadsheet, without reusing prior format or logic.
- Data arrives in different formats (CSV, JSON, YAML, Excel) that need to be unified by hand.
- Diagrams are made in separate tools, disconnected from the source data.
- Updating a report when the data changes means redoing the whole manual process.
Upload or connect your data
Import CSV, JSON, YAML or Excel files, or connect a recurring data source.
Choose the report type
Pick tables, charts or diagrams depending on what you want to communicate.
Tabulatrix generates the result
The report or diagram is built automatically from the structure of your data.
Share or schedule updates
Export the result or schedule it to regenerate automatically whenever the data changes.
Multiple input formats
Import CSV, JSON, YAML and Excel interchangeably, no manual conversion needed.
Automatic reports
Generate share-ready tables and summaries from your raw data.
Diagrams from data
Turn data structures into visual diagrams, no manual drawing required.
Scheduled refresh
Set your reports to regenerate automatically whenever the data source changes.
Report templates
Start from templates built for financial, operational or business reports.
Flexible export
Download your reports as PDF, Excel or image, ready to present or send.
Coming soon
Plans and pricing for this product will be announced soon.